

US PMI October 2026: Growth Cools to 57.6 While Prices Surge — What It Means for Your Money
The us pmi october 2026 flash release landed on October 23, 2026, and it delivered a split verdict on the American economy. The S&P Global flash US Composite PMI Output Index slipped to 57.6 from 58.4 in September — a two-month low — yet it still marks the second-sharpest increase in business activity since March 2022. Growth is cooling. Prices, though, are heating up at an alarming pace.
That’s the tension in this month’s data: factories and service firms are still expanding briskly, new orders are piling up, and companies are hiring. But selling prices rose at the sharpest rate since August 2022, and the output prices index hit a two-year high. In plain English, business is booming — and so is the bill.
This article breaks down exactly what the flash PMI data reported by Dow Jones Newswires means, why the inflation angle rattled markets, and what it could mean for the Federal Reserve’s next move — and your wallet.
Reading the us pmi october 2026 Numbers
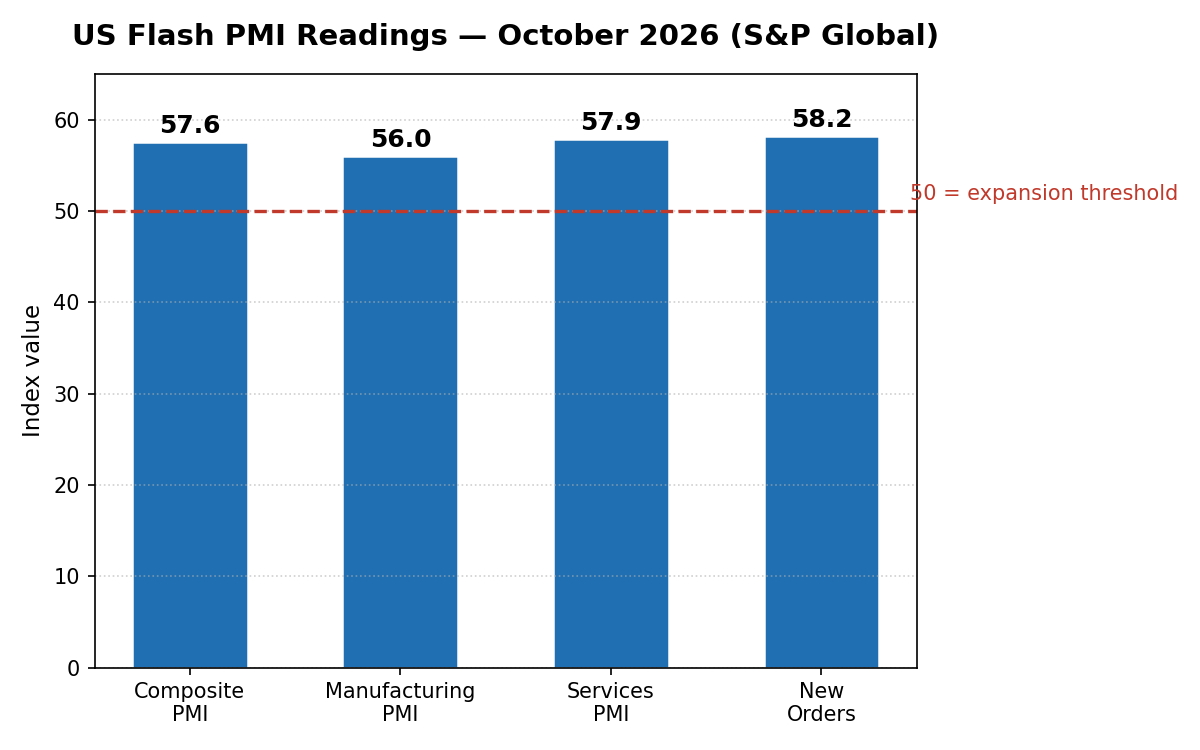
Here are the headline figures from the us pmi october 2026 flash report, released October 23, 2026:
- Flash Composite PMI: 57.6 (September: 58.4; consensus estimate: 57.6). A two-month low, but still signaling strong expansion — the second-fastest growth of business activity since March 2022.
- Manufacturing PMI: 56.0 — a 53-month high. Factories are firing on all cylinders.
- Services PMI: 57.9 — still firmly in expansion territory, though off the pace.
- New orders: 58.2 — the highest reading since March 2022, meaning demand keeps strengthening.
- Export sales: strongest gain since May 2022.
- Employment: hiring remained strong, with manufacturing payrolls rising the most since March 2012.
- Selling prices: sharpest rise since August 2022 across both goods and services; the output prices index reached a two-year high.
S&P Global’s chief business economist Chris Williamson said the numbers show the economy is still running hot: “October’s flash PMI data indicate that the U.S. economy continues to boom at the start of the fourth quarter.” He also flagged intensifying supply-chain bottlenecks and growing order backlogs — conditions that make it easier for companies to pass rising costs straight to customers.
The data landed exactly on consensus expectations (57.6 was the estimate), so there was no surprise on the headline. The real news was buried underneath it: the price surge.
What PMI Actually Measures — And Why 50 Is the Magic Number
If you’ve never followed the us pmi october 2026 releases before, here’s the quick version. PMI stands for Purchasing Managers’ Index. It’s a monthly survey-based indicator compiled by S&P Global from responses by purchasing executives at companies across the United States. These are the people who buy raw materials, hire workers, and place orders — they see turns in the economy before almost anyone else.
The index is a diffusion index on a 0–100 scale. The key dividing line is 50:
- Above 50 = the sector is expanding (more managers report improvement than deterioration).
- Below 50 = the sector is contracting.
- At 50 = no change.
At 57.6, October’s composite reading is comfortably above 50 — that’s not a borderline expansion, it’s a robust one. The “flash” release is a preliminary estimate published roughly a week before the final numbers, based on about the first 85 percent of survey responses. Markets and economists watch it closely because it’s one of the earliest reads on how the month actually went.
The composite index blends manufacturing and services, weighted by their contribution to the economy. With services making up the bulk of US economic activity, the services reading usually dominates — which is why the two components pulling in slightly different directions this month is worth a closer look.
Manufacturing Is on a Tear While Services Hit the Brakes

The most surprising detail in the flash US PMI October 2026 data is how strong factories look. Manufacturing PMI ticked up to 56.0, a 53-month high — the best reading for US manufacturing in more than four years. Manufacturing payrolls grew at the fastest pace since March 2012, and export sales posted their strongest gain since May 2022.
That’s a remarkable turnaround for a sector that spent years in the doldrums. Strong new orders — up at 58.2 overall, the highest since March 2022 — suggest factories aren’t just working through old backlogs; fresh demand is arriving. Export strength points to overseas buyers regaining appetite for American-made goods.

Services, by contrast, cooled to 57.9. That is still a very healthy number — services have been the engine of US growth for years — but it shows the larger side of the economy losing a little momentum. When you combine the two with new orders at their highest since March 2022 and order backlogs growing, the picture is an economy with plenty of demand but tightening supply chains.
And that’s where the trouble starts. Growing backlogs plus supply-chain bottlenecks give companies pricing power. When every competitor is also raising prices, nobody loses customers by doing the same. Williamson’s warning was explicit: these conditions make it easier for firms to pass costs on.
The Inflation Twist: Selling Prices Rise at the Fastest Pace Since August 2022
This is the part of the report that matters most to ordinary households. Selling prices across goods and services rose at the sharpest rate since August 2022, and the output prices index hit a two-year high.
Think about what that means in practice. The businesses surveyed aren’t just paying more for their own inputs — they’re charging more for what they sell. Those charges ripple down the supply chain until they land on price tags. It is, essentially, a preview of future consumer-price inflation.
As Reuters reported on October 23, the story here is robust demand: when customers keep buying, businesses can raise prices without losing sales. That is a classic sign that inflation could not only increase further but remain persistently high — exactly the scenario the Federal Reserve has been trying to avoid.
Reuters also flagged a wildcard that has economists on edge: the oil price shock from the US-Israeli war with Iran has not yet dented business activity, but its inflation fallout could slow consumer spending this quarter as higher fuel costs filter through to household budgets. An economy booming on strong demand is resilient — but it is also exactly the kind of economy where an oil shock hurts most, because price pressures are already elevated.
Finimize’s daily brief put the consumer angle bluntly: sticky price growth is a headwind for anyone carrying variable-rate debt — think credit cards and HELOCs — because inflation pressure makes the Fed less likely to cut rates. If you’re carrying a balance, that’s the part of this report that hits closest to home.
What It Means for the Fed and Markets

Flash PMI data is catnip for Fed watchers, and the October print complicates the central bank’s life. Here’s why: the Fed’s dual mandate is stable prices and maximum employment. This report shows both sides moving in the wrong direction for rate cuts — hiring remains strong, and price pressures are intensifying.
Remember the backdrop. Since the Fed rate hike in 2026, every inflation print has moved expectations about the central bank’s next step. A report showing growth at 57.6 with selling prices rising at their fastest pace in four years gives rate-cut advocates almost nothing to work with. Markets price in fewer, later cuts when inflation looks stubborn — and this data makes inflation look stubborn.
The bond market reaction tells the story. Inflation-sensitive assets hate exactly this combination: growth that’s hot enough to sustain demand, plus pricing power that keeps inflation elevated. Investors who were hoping for a cooling economy to pave the way for lower borrowing costs got half of what they wanted — the “cooling” — and none of the part that matters for rates.
For context, this data arrived just a week after markets were already jittery. The Nasdaq’s 2.6% selloff earlier in October showed how quickly sentiment can turn when rate expectations shift. Strong PMI numbers with a hot price component add fuel to that same worry.
What to Watch Next
The flash PMI is the opening act, not the finale. Here’s the data calendar that matters from here:
- Final PMI readings (early November): confirm or revise the flash numbers. Revisions are usually small, but watch the price components.
- Advance Q3 GDP (expected next week): economists are looking for growth of around 3.0% annualized. If the GDP number comes in hot too, the “strong growth plus sticky inflation” story gets much harder for the Fed to ignore.
- Consumer inflation data: the selling-price surge in the PMI is a leading indicator. If it shows up in the official inflation figures, rate-cut hopes take another hit.
- Oil prices and the war shock: the PMI shows the oil price shock hasn’t dented activity yet. Watch whether that changes — and whether the inflation fallout shows up in consumer spending this quarter.
And it’s worth keeping the equity market backdrop in mind. The October 2026 AI stock market rebound showed investors still have an appetite for risk — but rate expectations are the swing factor. If the PMI’s price signal feeds through to actual policy, that appetite gets tested.
FAQ: US PMI October 2026
What is the PMI?
PMI stands for Purchasing Managers’ Index, a monthly survey compiled by S&P Global from purchasing executives at US companies. It’s a diffusion index on a 0–100 scale where above 50 means expansion and below 50 means contraction. The composite index combines manufacturing and services.
What was the US PMI in October 2026?
The flash US Composite PMI for October 2026 came in at 57.6, down from 58.4 in September — a two-month low, but still the second-sharpest expansion of business activity since March 2022. Manufacturing hit 56.0 (a 53-month high) while services came in at 57.9.
Why is the October PMI significant?
Because of the price data underneath the headline. Selling prices rose at the sharpest rate since August 2022 and the output prices index hit a two-year high — a sign inflation pressure is building again even as growth cools slightly. That’s the combination the Fed fears most.
What is the difference between flash and final PMI?
The flash PMI is a preliminary estimate released about a week before the final numbers, based on the bulk of survey responses collected so far. Final readings can differ slightly, but the flash version is what markets react to because it arrives first.
Does a falling PMI mean a recession is coming?
Not at 57.6. The PMI only signals contraction below 50. A reading of 57.6 means the economy is still expanding robustly — it’s just growing a bit slower than the month before. Recession warnings start when the index approaches or falls below 50.
How does the PMI affect mortgage rates and savings?
Indirectly but powerfully. Hot PMI price data reduces the odds of Fed rate cuts, which keeps borrowing costs — mortgages, credit cards, auto loans — elevated and can support higher savings-account yields. If you carry variable-rate debt like a HELOC, sticky inflation is bad news, so review how much emergency fund you need before rates stay high longer than expected.
Conclusion
The us pmi october 2026 flash report is one of those data points that looks benign on the surface and uncomfortable underneath. Growth at 57.6 with new orders at their highest since March 2022? That’s a boom. Selling prices rising at their fastest pace since August 2022 with the output prices index at a two-year high? That’s an inflation warning — and it’s the louder signal.
For the Fed, this report tilts the balance toward caution: strong demand, strong hiring, and intensifying price pressure make the case for holding rates higher for longer. For households, the takeaway is simpler — the cost of living may keep climbing even as headlines celebrate a strong economy, so it’s worth stress-testing your budget against the possibility that borrowing costs don’t come down as quickly as hoped.
Watch the final PMI numbers and next week’s advance Q3 GDP report. If they confirm what the flash data suggests, the “hot economy, sticky prices” story will dominate the conversation into year-end.
Disclaimer: This article is for informational purposes only and does not constitute investment advice. Economic data can be revised, and past performance does not guarantee future results. Consult a qualified financial professional before making investment decisions.